
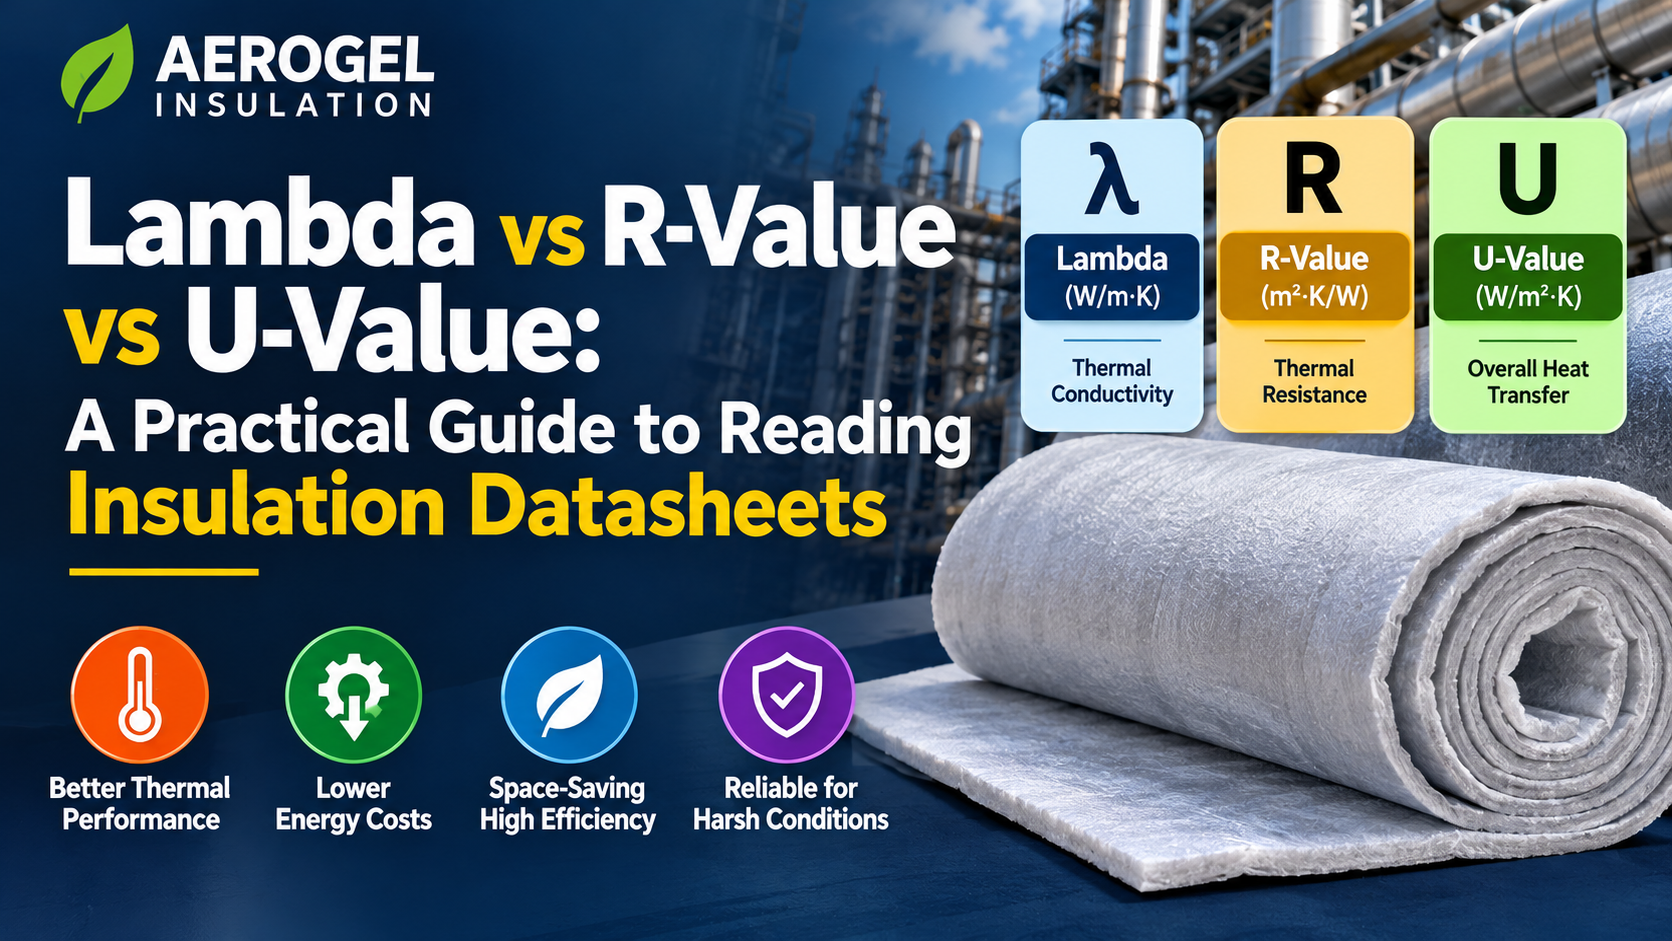
Pick up three insulation datasheets, and you’ll often find three different ways of describing performance. One quotes thermal conductivity in mW/m·K, another an R-value per inch, and a third a U-value for a finished assembly. Buyers end up comparing numbers that measure different things, under different test conditions, sometimes in different unit systems.
This guide explains what lambda, R-value, and U-value each measure, how they relate, which one matters for which decision, and what to check on a datasheet before trusting any of them. The worked examples use silica aerogel, but the principles apply to every insulation material.
The Three Numbers in One Line Each
Lambda (λ), also called thermal conductivity or the k-value, is a property of the material. It tells you how readily heat passes through a unit thickness. Lower is better.
R-value, or thermal resistance, is a property of a specific layer: the material at a specific thickness. Higher is better.
U-value, or thermal transmittance, is a property of a whole assembly, including the air films at its surfaces. It tells you how much heat passes through each square meter for every degree of temperature difference. Lower is better.
Lambda describes the material, R describes the layer, and U describes the finished construction. Most datasheet confusion comes from mixing those three levels up.
Lambda: The Material Property
Thermal conductivity is expressed in W/m·K: heat flow in watts through a one-meter-thick slab, per square meter of area, per kelvin of temperature difference. Because good insulation values are small numbers, many datasheets quote them in milliwatts instead, so 0.016 W/m·K and 16 mW/m·K are the same value. American datasheets often use imperial units, Btu·in/(h·ft²·°F). One W/m·K equals about 6.93 in those units, so 0.016 W/m·K is about 0.11.
Lambda isn’t a single fixed number for a material. It depends on several things.
Mean temperature. For most insulation materials, λ rises as temperature rises. A value measured at room temperature can be noticeably lower than the value at the mean temperature of insulation on a hot steam line. The ASTM C335 pipe insulation test method makes the same point: when applying measured conductivity to a design, correct the values for any change in mean temperature. A credible datasheet states the temperature for each λ value, and for hot or cold service it gives a curve or a table across temperatures, not a single figure.
Moisture and aging. Wet insulation conducts more heat. Some foams lose performance over time as the gas in their cells slowly diffuses out and is replaced by air. The international standard ISO 10456 provides conversion factors to adjust a declared λ for temperature, moisture, and aging to get a design value. If the declared value already accounts for aging, apply no further aging correction.
Density and compression. Fibrous and blanket materials perform differently when compressed. The λ on the datasheet applies at the tested density.
R-Value: Material Plus Thickness
For a flat layer, thermal resistance is simply thickness divided by conductivity:
R = d ÷ λ, with d in meters and R in m²·K/W.
Resistances in series add together, which makes R convenient for multilayer builds: the total resistance of a stack is the sum of its layers.
The common catch is units. In SI, R is in m²·K/W. In the United States, R is expressed in h·ft²·°F/Btu, and 1 m²·K/W equals about 5.68 imperial units. So an “R-13” from an American datasheet is roughly 2.3 m²·K/W. Always check which system a number is in before comparing it.
As a worked example, take DashamLabs’ flexible silica aerogel sheet, which has a thermal conductivity of about 0.016 W/m·K at room temperature.
A 10 mm sheet gives R = 0.010 ÷ 0.016 = 0.625 m²·K/W, or about R-3.5 in imperial units. Expressed per inch of thickness, the same material works out to about R-9 per inch in imperial units at room temperature.
Pipes Don’t Follow the Flat-Slab Rule
Most industrial insulation goes on pipes, and here the simple R = d ÷ λ formula no longer applies. On a cylinder, each extra millimeter of insulation sits at a larger radius and covers more area, so its resistance contribution shrinks. Pipe insulation resistance is therefore expressed per meter of pipe length (lineal resistance, in m·K/W) and calculated with a logarithmic formula:
R′ = ln(r₂ ÷ r₁) ÷ (2π × λ)
Here r₁ is the pipe’s outer radius, and r₂ is the outer radius of the insulation.
For a 4-inch pipe (114.3 mm outside diameter) insulated with aerogel at λ = 0.016 W/m·K (room-temperature value, used for illustration only):
| Insulation thickness | Linear resistance (m·K/W) | Compared with 10 mm |
| 10 mm | ~1.60 | 1.0× |
| 20 mm | ~2.99 | ~1.9× |
| 40 mm | ~5.28 | ~3.3× |
Doubling the thickness gives less than double the resistance, and quadrupling it gives only about 3.3 times as much. That’s why you shouldn’t use flat-sheet R-values to size pipe insulation. That’s why you shouldn’t use flat-sheet R-values to size pipe insulation.
The ASTM C335 pipe insulation test method reflects this. It reports linear thermal resistance per unit length of pipe as its preferred measure. Its results include the effects of how the insulation fits the pipe and its joints, but exclude outer-surface resistance. ISO 8497 is the comparable international method.
U-Value: The Whole Assembly
The U-value adds what R leaves out: the thin layer of still air on each surface, which provides some resistance of its own. Total resistance is the sum of the internal surface resistance, each material layer, and the external surface resistance:
R_total = R_si + R₁ + R₂ + … + R_n + R_se, and U = 1 ÷ R_total
For walls with horizontal heat flow, the usual conventional values under ISO 6946 are R_si = 0.13 m²·K/W and R_se = 0.04 m²·K/W.
These surface films make a big difference for thin layers. Using the 10 mm aerogel sheet from before alone, the layer’s R of 0.625 corresponds to a conductance of 1.6 W/m²·K. Add the two surface films, and the total resistance becomes 0.795, giving a U-value of about 1.26 W/m²·K. With thick insulation, the films matter less, but they still count, and a datasheet that quotes U without surface resistances overstates heat flow, or quotes conductance and calls it U.
U-values are mainly a buildings and enclosures concept: walls, roofs, cold rooms, vehicle bodies, battery enclosures. A real U-value also depends on thermal bridges such as fixings, frames and studs, which bypass the insulation. That’s why an assembly can perform worse than the sum of its layers suggests.
Which Number for Which Decision
Comparing two insulation materials: use λ, but only at the same mean temperature and under comparable test conditions.
Sizing insulation for a flat panel, liner or enclosure wall: use R for the layer, then the U-value for the assembly once surface films and frames are included.
Sizing pipe or equipment insulation: neither a single λ nor a flat-sheet R is enough. Industrial heat loss and surface temperature calculations follow methods such as ASTM C680, using λ values across the operating temperature range. The result is usually expressed as heat loss per meter of pipe (W/m) or per square meter of surface, together with the outer surface temperature.
Checking a building against an energy code: use the U-value, since most building energy codes set maximum U-values for envelope elements.
Six Questions to Ask of Any Datasheet
Before comparing products, check these points on each datasheet.
- At what mean temperature was λ measured? A λ at 10 °C or 24 °C tells you little about performance at 200 °C or –40 °C. For anything outside the comfort range, ask for a λ versus temperature curve.
- Which test method was used? Flat specimens are typically tested with a guarded hot plate or heat flow meter apparatus. Pipe insulation is tested with a pipe apparatus under ASTM C335 or ISO 8497. If the method isn’t stated, you can’t properly compare the value.
- Is it a declared value or a typical value? Under ISO 10456, a declared value is set so that at least 90% of production meets it at 90% confidence, which is why it’s often written as λ90/90. A “typical” or “nominal” value may simply be an average and could be more favorable than what a given batch delivers.
- Which units are being used? W/m·K vs mW/m·K, SI R vs imperial R, R vs R per inch. A tenfold, or roughly sixfold, error is easy to make if you don’t check the units.
- At what density and thickness was it tested? Blankets and fibrous products should state the tested density and whether the value applies at nominal thickness or under compression.
- Does it account for aging and moisture? For foams and other moisture-exposed products, check whether the declared λ already includes aging and whether the material maintains performance when wet.
Reading an Aerogel Datasheet with These Questions
Applied to DashamLabs’ product data: the headline figure is a thermal conductivity of about 0.016 W/m·K at room temperature, with a published range of 0.016–0.030 W/m·K. The lower end applies near room temperature. Values toward the upper end become relevant as temperatures rise into hot service. For an operating range of –50 °C to 650 °C, the right design figure is the value at your insulation’s mean temperature, so ask for the temperature-dependent data before sizing hot or cold service.
The same applies to the thickness comparison. DashamLabs rates its sheet as 70% thinner than traditional insulation. Exact savings for a given project depend on which material you replace and the operating temperature of both materials. The fairest way to compare is to set both λ values at the same mean temperature and calculate the thickness each needs to meet the same heat-loss or surface-temperature target.
The Bottom Line
Lambda tells you how good a material is. R tells you how good a specific thickness of it is. U tells you how well the finished assembly performs once surfaces, frames, and fixings are included. Most datasheet confusion, and many disappointing installations, come from comparing values at different temperatures, in different units, or at the wrong level. Ask for λ at your operating mean temperature, use logarithmic sizing for pipes, include surface resistances in U-values, and check whether each figure is declared or typical.
For complete technical data on DashamLabs’ silica aerogel sheet, see the technical specifications or request a sample to test in your own application. For related reading, see our aerogel insulation blanket thickness guide and operating at limits: aerogel at –50 °C vs 650 °C.